

IT Policy Roadmap · $4,999
The Planning Engagement turns your Diagnostic baseline into a sequenced, defensible improvement plan, ranked 0 to 100 and benchmarked against your peers.

Produces the final report in ten business days and includes a 30-minute strategy session.
Builds on the Diagnostic; the $399 fee credits toward it within 90 days.
What the Roadmap produces
The Diagnostic tells you where you stand. The Roadmap scores all 41 framework items, 17 policies and 24 standards, ranks every one on a 0 to 100 Improvement Priority scale, and sequences them into a plan you can defend to a board or an audit committee: what to write first, what can wait, and why each priority earned its place.
1. Every gap becomes a 0 to 100 Improvement Priority score
We weigh each gap by its impact, how many framework elements are missing, and whether it carries regulatory exposure, then scale the results so your single highest-impact policy project scores 100 and every other ranks beneath it. Hundreds of possible moves become one ordered list of what to do next.
2. All 41 items are ranked and phased
Improvement priorities
Roadmap deliverable, illustrative
#
Ref
Item
Status
Coverage
Priority
Phase
1
P-13
Third-Party Risk Management
Not Found
0/8 (0%)
100
90-Day
2
P-06
Incident Response
Partial
4/9 (44%)
84
90-Day
3
S-21
Ransomware Response Procedures
Not Found
0/6 (0%)
67
90-Day
4
S-09
Security Monitoring and Logging
Partial
3/7 (43%)
38
One-Year
5
P-12
AI Governance
Not Found
0/5 (0%)
22
One-Year
+ 36 more items, each scored and phased
3. The plan is time-phased, with effort and approvals
90-Day
Quarter one
Build momentum. Quick wins and critical fixes: approve pending drafts, formalize existing practice, close regulatory exposure.
Quick Wins
Critical Fixes
One-Year
Months 4 to 12
Shore up the foundation, carry the structural loads, then expand ahead of emerging sector trends.
Foundation (Universal)
Structural Loads (regulatory + Common)
Expansion (Emerging)
Deferred
Next cycle
Items beyond this year's capacity, held with rationale and returned as candidates at the next annual assessment.
Carried to reassessment
⬢
Each phase ships with estimated drafting and governance hours, a suggested team, the approvals required, and a target maturity advancement, so the plan is costed and owned, not just listed. Documentation effort only; running the programs those policies describe is scoped separately.
Peer benchmarking
The Roadmap places your Diagnostic Score against the distribution of peers in your CampusCISO Tier, assigned by Carnegie Classification, so a board or an underwriter sees evidence rather than assertion.
2026 IT Policy Study
Where every tier lands
Governance maturity by institutional tier
Tier 1
Tier 2
Tier 3
Tier 4
Tier 5
Special Focus

Maturity tracks institutional type: each tier's box shows its middle 50 percent, the dots are individual institutions, and the four bands are the maturity levels. In your report, your institution's score is plotted as a marker on your tier's column, so you see exactly where you sit among peers.
2026 IT Policy Study
Your tier, in depth
The Tier 1 distribution, score by score
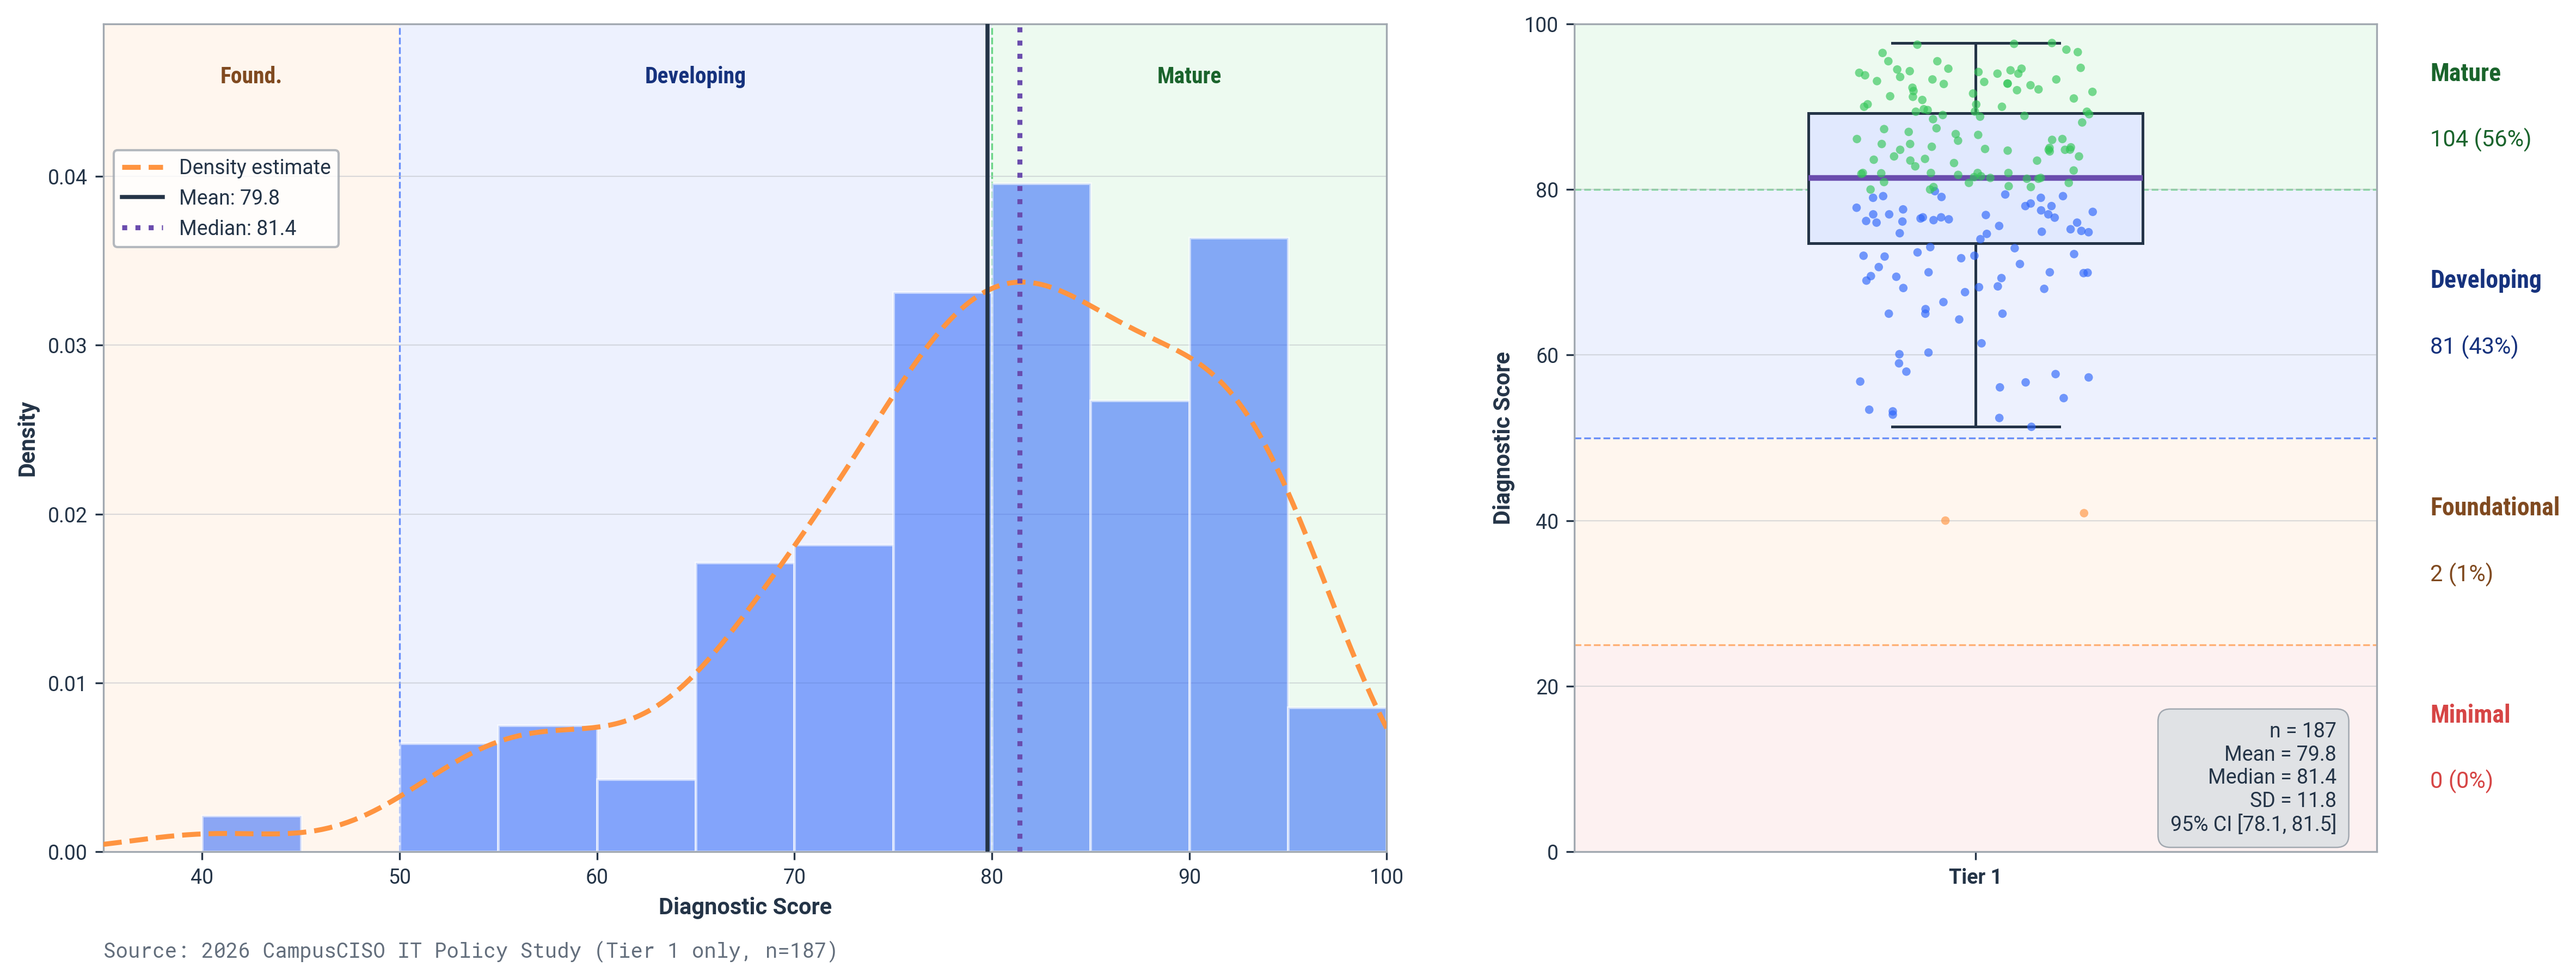
For your own tier, the report zooms in: the actual shape of the distribution (most R1s already sit in the Mature band) and where any single institution falls against the mean and median. Source: 2026 CampusCISO IT Policy Study, published in Building IT Policy Programs for Higher Education.
⬢
Benchmarking grounds the recommendation; it doesn’t generate it. The framework produces the plan. Peer comparison data, drawn from 400+ policy libraries, defends it.
What's included
The Diagnostic establishes the baseline; the Roadmap turns it into a plan you can execute and defend.
⬢
Content-level review of every policy and standard in your portfolio
⬢
A 0 to 100 Improvement Priority score for all 41 framework items
⬢
A time-phased plan: 90-Day, One-Year, and Deferred
⬢
Effort estimates, a suggested team, and required approvals per phase
⬢
Peer benchmarking against your CampusCISO tier
⬢
A 30-minute strategy session to walk through the plan

The Roadmap sequences every gap into a defensible, board-ready plan, benchmarked against your peers, with a strategy session to walk it through.