Comparing your assessment results with other institutions
Benchmarking reports are a powerful feature available to paid CampusCISO members. These reports let you compare your assessment results with other institutions.
There are high-level benchmarking reports available under the reports menu:
- Technical Capabilities Benchmark
The technical benchmark compares the solutions you’ve adopted in each CYBER HEAT MAP assessment category. This helps you see how your technology adoption compares with other institutions.
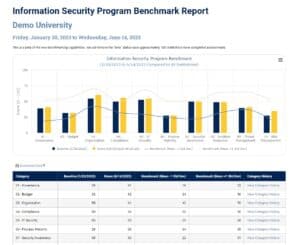
- Information Security Program Benchmark
- The security program benchmark compares your program across 10 domains using both technical and non-technical data. We developed this report with input from member CIOs and CISOs to provide a high-level summary suitable for reporting to boards and executives.

Selecting specific comparison dates
By default, these benchmark reports show you data from your oldest and newest saved snapshots. You can adjust the dates using the drop down selectors if you want to compare specific snapshot dates. This can be useful if you’ve been using CampusCISO for multiple years and want to show improvement over a specific timeframe.

Reviewing the summary chart
Comparing your score trends
The summary chart gives you a high level view of your assessment results and how you compare with other institutions.
The vertical bar charts show your scores for the two comparison dates that you selected.

Benchmark comparison data
The horizontal lines on the chart show the benchmark comparisons for each category.
These lines show one standard deviation above and below the mean for all assessments saved in the previous 12 months. This helps you compare your score to the middle 68% of other institutions, so you can see if you are above or below average.
(NOTE: Right now, the comparisons do not allow you to filter by institution type. As CampusCISO continues to grow, we plan to add additional filters so you can compare your score to institutions that are similar in size, research focus, etc.)

Downloading the benchmark data
You can easily download the benchmark data to use in presentations and reports.
Downloading the chart
If you just want the chart, you can download it using the “hamburger menu” in the right corner of the chart.

Downloading the data as a CSV
You can also download the benchmark data as a CSV, so you can create your own charts and reports.

Reviewing historic scores and trends
If you want to see how your score and the associated benchmarks have changed over time, you can click the “View Category History” link. This will open a pop up window showing your score and the benchmark range for every date that you’ve saved a snapshot.

Other areas where benchmarking is available
While the two benchmark reports are the main area where we’ve enabled comparison data, it’s not the only way you can leverage CampusCISO to compare your security program with other institutions.
Some of the detailed report views, such as the Capability Details report, include a link to show a benchmark comparison.
When you click this link, it will expand to show benchmarking data for that specific assessment area.