Chris Schreiber
In higher education, cybersecurity is essential overhead, not a profit center. This article shows how to move beyond ROI theater by framing security as stewardship, with clear service tiers and mission-focused metrics that connect budgets to teaching, research, and student services.
You’ve seen the articles. Security leaders need to prove their business value. Stop being a cost center. Show ROI. Demonstrate how security drives growth.
That advice doesn’t really work in higher education.
At universities, cybersecurity is a cost center. So are facilities, insurance, libraries, and providing email. Pretending security is a growth engine confuses the conversation and sets you up to argue the wrong case.
Early in my career, I felt obligated to build a ROSI (return on security investment) model during a budget cycle. My team and I spent weeks crafting spreadsheets, debating breach probabilities and dollar costs.
The model looked rigorous. Leaders distrusted the assumptions. The conversation stalled. Urgent improvements slipped another year.
That is the harm. ROI framing invites arguments about hypotheticals instead of decisions about desired service levels.
The pressure to justify security through profit center frameworks reflects decades of cybersecurity being viewed as overhead. So security budgets often get justified through fear: breach headlines, regulatory fines, worst-case scenarios.
But fear wears off. And spreadsheets full of speculative math do not earn trust.
The honest context for security investments is stewardship.
Security protects the mission by keeping learning platforms available, safeguarding research data, and preventing disruptions to student services.
That is value. It shows up as resilience and continuity rather than new revenue.
Stewardship also needs to be visible. Treat it as a service with measurable metrics, not just a vision statement. You can track key metrics such as:
Tracking and reporting these numbers shows how security protects the academic mission, not just how many tools you own.
I saw this shift work during a budget conversation with a research center director. They pushed back on security requirements for a new sponsored project, calling the controls an “unfunded mandate.”
Instead of arguing ROI, I reframed the conversation around stewardship.
“We are stewards of sponsor data and IP. The sponsor pays us to produce results and protect the inputs that make those results credible.”
We swapped “compliance requirements” for “contracted responsibilities.” We tied each control to integrity, availability, and confidentiality of research outputs.
By mapping controls to the project lifecycle, we showed what was needed before data intake, during analysis, and at publication. Costs became predictable and phased.
We quantified practical outcomes researchers cared about: lab downtime during an investigation, corruption of research data, missed publication windows, eligibility risks for the next award.
Eventually, the lab director allocated a small amount from contingency funds to add multi-factor access, implement secure storage, send critical logs to the university’s central SIEM, and add data handling training for staff.
This shift happened because the ask felt like research hygiene, not bureaucracy. Framing as stewardship moved the discussion from “Why are you taxing my research?” to “How do we ensure the science is protected and future awards are not at risk?”
Even when framing good security practices as stewardship, people will raise hard questions about cost and complexity. Addressing those objections ahead of time can help.
“This feels like an unfunded mandate.” Map each requirement to a specific obligation or outcome, such as sponsor requirements, student privacy, or accreditation. Treat it as part of the cost of delivering the service, then invite them to stage the work over multiple budget cycles instead of all at once.
“We cannot afford this level of protection.” Offer a minimum viable stewardship level and a preferred level. Show in plain English what each tier protects and what risks the institution is choosing to accept if it stays at the minimum.
“We do not have staff to run this.” Clearly identify setup effort versus ongoing operations. Highlight what can be supported centrally, what must live in the department, and where automation or external vendor support can absorb some of the work. Then ask which outcomes matter most so you can sequence the improvements.
Instead of arguing about whether security is optional, you are discussing which level of stewardship the institution is willing to fund and support.
Every cost center must justify its budget. Information security programs are not alone in this. People understand that facilities, libraries, and even IT services such as email are a cost of doing business.
Instead of fighting this label, we can learn from how other cost centers manage their budget discussions. The best ones do it by showing services, performance, and tradeoffs. Security leaders can do the same.
Service catalog and SLOs. Facilities list services and targets. Do the same for security. For example, you could describe your core services, such as endpoint protection, identity provisioning, and incident response. Publish clear SLOs for patch cadence, MFA coverage, and incident detection and containment times.
Lifecycle and backlog. Facilities report on deferred maintenance and replacement plans. Present a security debt register of unsupported security capabilities and aging solutions. Show a phased catch-up plan and the impact of deferral on the institution’s technology resilience.
Availability and drills. Email teams report uptime and recovery tests. Report resilience metrics that matter to operations: mean time to detect and contain incidents, disaster recovery test results, tabletop exercise participation.
Demand forecasts. Facilities plan for new buildings. The plans include the actual construction, but also forecast maintenance and operations costs. Forecast security demand from research grant growth, new SaaS tools deployed by the institution, enrollment shifts, and device counts. Then, show how security funding links to concrete outcomes for those forecasts.
Tiers and tradeoffs. Libraries may explain budgets in terms of service tiers. They can explain tradeoffs in hours of operation or number of journals available to researchers. Do the same for security by offering tiered goals tied to data classification, and spell out what each tier protects, what it costs, and what risks remain.
Sample Security Service Tiers :
Tier 1: Critical data services, such as the LMS, course registration, financial aid, regulated research, and payroll. These systems might require 24x7 monitoring, MFA, network segmentation, and robust disaster recovery. This tier carries the highest cost, reflecting the risk if these services are compromised.
Tier 2: Important services with tolerance for short outages, such as advising tools, departmental sites, ancillary research systems, and administrative applications. Controls might include MFA, daily backups, baseline segmentation, and business-hour monitoring.
Tier 3: Lower-risk or public information systems such as marketing websites and lab sandboxes. The focus here might be basic system hardening guidelines and regular vulnerability patching.
Leaders can see the requirements to move a system from one tier to the next. This helps them make informed choices about whether the additional stewardship is worth the cost.
Skip FUD and abstract risk heat maps. Speak in terms of outcomes, gaps, and a practical plan. You won’t get a yes every time, but you will earn trust when you present board-ready choices.
After major incidents, I have watched recovery costs dwarf what basic prevention and upkeep would have required. This is like replacing a roof after years of leaks.
A typical pattern: ransomware takes down student services and research systems. Online counseling intake forms stop working, online exam systems are unavailable, housing and dining systems stall, and research compute clusters sit idle. The institution scrambles with emergency consultants, overtime for IT, rebuilds of hundreds of endpoints and servers, legal and privacy notifications, vulnerability remediation, and lost research and staff time.
The cost is not just money. It includes weeks of disruption, reputational harm, and delayed work.
The painful part is that a security debt register often already identified the root causes: incomplete MFA, weak privileged access controls, stale EDR coverage, flat networks without segmentation, untested offline backups, and deferred system vulnerability patching.
Higher education has the slowest recovery time of any sector, with 40 percent of institutions taking more than one month to recover from a ransomware attack. Institutions with compromised backups faced recovery costs five times higher than those with a current backup available.
On average, it costs a US educational institution $550,000 per day of downtime, and the average recovery cost is $1.42 million.
Implementing foundational risk prevention is not glamorous, but it is cheaper and less disruptive than recovery from a serious security incident.
When you present metrics to a board or cabinet, they care about how the metric relates to what breaks for students, faculty, and research.
If you say “MTTD is 25 minutes,” eyes glaze over. If you say “we can keep registration online during peak class enrollment because we detect and contain attacks in under 30 minutes,” heads nod.
Uptime → Teaching continuity. “LMS availability was 99.95% this term. That protected 12,000 exams and avoided makeup chaos during finals. Target is 99.97% next term, which requires funding for redundancy.”
Tested restores → Finish the semester. “We restored a core database from offline backups in 42 minutes in last month’s test. That means if storage fails, or an attacker corrupts the data, we can resume normal classes the same day. Target is under 30 minutes, which needs more frequent drills and staff training.”
Containment time → Student services online. “Median containment time is 28 minutes. That keeps financial aid, payroll, counseling scheduling portals, and online class portals available during peak traffic. Target is 20 minutes with outsourced coverage on nights and weekends.”
Privacy incidents → Student trust. “We had zero reportable breaches affecting sensitive faculty, staff, and student data this year. That protects our entire community and helps staff remain focused on teaching and research instead of incident response. Target is to keep that number near zero as we expand logging and access controls in environments with sensitive data.”
Clean audits closed on time → Grant eligibility. “We closed 100% of audit findings within 60 days. That positions us to meet federal research requirements.”
Create a one slide dashboard that communicates the metrics and their impact: metric, mission outcome, trend, and the single improvement needed to hit the next target.
When the board sees outcomes tied to the academic mission, they lean in, ask better questions, and are more willing to fund the next step.
Institutions regularly fund insurance policies, rarely thinking about it as an “unfunded mandate.” But in higher education, there is pressure to justify cybersecurity differently.
This is because of a maturity and visibility gap. Libraries and insurance have been baked into university life for generations, so no one feels the need to justify them using ROI language.
Cybersecurity is newer, less visible when it works, and often shows up as “new rules” that feel imposed from the outside. Many institutions only formalized a CISO role in the last decade. That newness means people remember “when we did fine without it,” so new security initiatives get labeled as unfunded mandates.
Success in security looks like nothing happening. A quiet semester feels like a cost, not a win. Meanwhile, the library, email services, and facilities show daily, tangible service delivery that stakeholders can see every day.
Technology changes faster than budgeting cycles, so costs look like moving targets.
Multiple departments share responsibility for implementing controls, which makes ownership and benefits feel diffuse.
Regulatory and sponsor requirements are framed as compliance mandates, not responsible stewardship of research, students, and operations.
Normalize cybersecurity as a standing utility cost, with a clear service catalog and SLOs.
Report mission outcomes, not lists of tools. For example, maintain a dashboard showing uptime, clean audits closed on time, tested restores, and incident containment time.
Tie budget requests to contracted responsibilities and academic continuity, so investments read as core operations, not simply additions to grow the information security program.
By constraining strategic metrics to one slide, it forces information security leaders to focus on clarity. You can move technical details to the appendix where they belong.
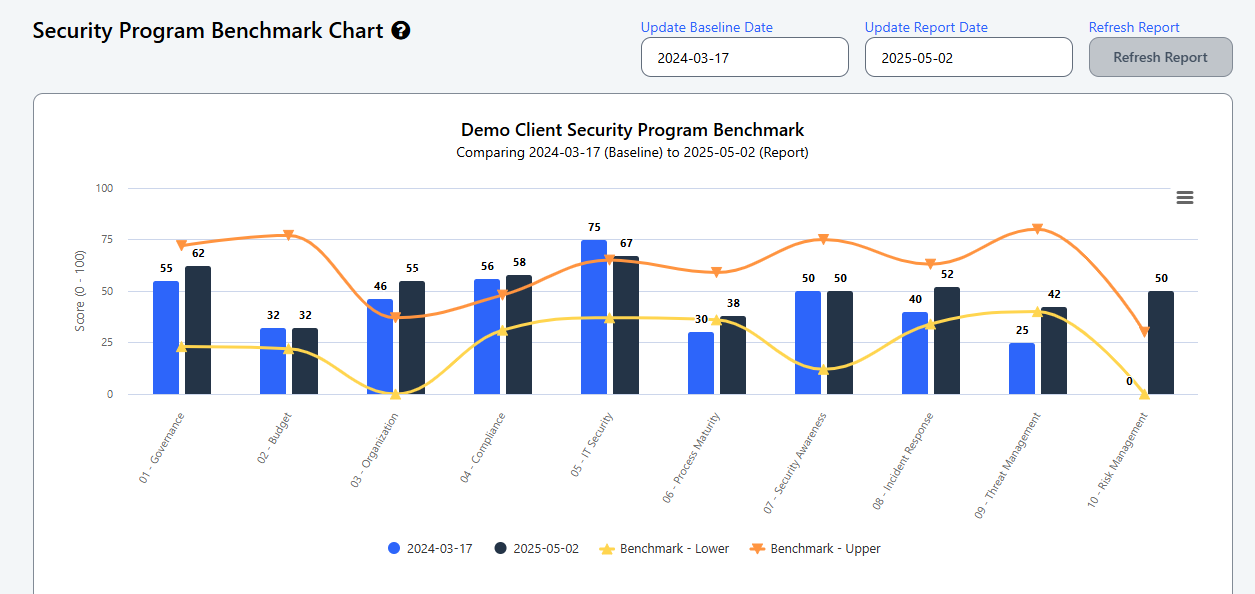
When we developed the Cyber Heat Map® Security Program Benchmark Report, we worked with many of our client CIOs to develop a simple framework to report on security program status, progress, and future goals. This chart shows trends in program metrics plus an easy-to-understand peer benchmark.
Similarly, we built the Improvement Recommendations report to show which potential projects will have the biggest relative impact on your security program. Instead of drowning in spreadsheets and disconnected project requests, leaders can see the relative importance of each project next to others.

This living platform helps leaders maintain a ranked queue of projects. Using this data, you can have plain English conversations about how new projects impact teaching, research, and operations. Instead of presenting long shopping lists, you can show the next best moves.
Quarterly rhythm replaces sporadic asks. When a tool ages or a gap emerges, the team adds it to the queue, scopes it, and presents it with other needs in context.
With these reports, the Security Program Benchmark and Improvement Recommendations, stakeholders can see progress and understand what unlocks the next step.
A technical appendix can carry the details: SOC metrics, architecture, risk analysis, and control maps. When someone wants a deep dive, they still have the information available. But stakeholder conversations focus on clarity tied to operations goals instead of technical detail.
The result is better questions and faster decisions. Instead of debating log retention requirements and complicated audit checklists, leaders discuss tradeoffs they understand: uptime for LMS and registration, continuity for counseling and accessibility services, tested restores for core databases, and sponsor-ready research environments.
Simplicity does not diminish rigor. It is an executive translation that keeps the institution’s mission at the center and the security program moving.
If you read an article telling you to prove security’s business value beyond being a cost center, remember this:
Call cybersecurity what it is in higher education: essential overhead.
Lead with stewardship, clear service levels, and mission outcomes, not ROI theater.
The honest path is not proving ROI. It is defining the outcomes the institution needs, pricing the security capabilities needed to deliver them, and making transparent tradeoffs in the open.
Start by defining three mission outcomes your board already cares about, then map your current security work to those outcomes. That is how you move work forward without pretending security is a profit center.

Start Your 30‑Day Diagnostic - $399
Build a data‑informed, board‑ready cybersecurity plan in 30 days.
Includes expert guidance, 30‑day access to the Cyber Heat Map® platform, and weekly group strategy sessions.
No long‑term commitment. Just results.
Secure your seat today.